Authoring Tutorial
The Culture Data Story Laboratory is a place for working with cultural heritage knowledge graphs and publishing the results as interactive data stories. Readers use it to explore published stories. Authors use the LODEON workbench to investigate graph data, collect evidence, write interpretations, and create publishable outputs.
A data story is a written narrative enriched with interactive data elements. It can contain prose, live query results, tables, charts, visual query nodes, and links back to the data used in the story. This makes it useful for research communication, teaching, exploration, and transparent interpretation.
1. Understand the LODEON workbench
LODEON is the authoring and exploration workbench of this platform. It brings the main parts of evidence-based knowledge graph work into one workspace:
- select the active knowledge graph,
- ask questions and collect evidence,
- write and structure notes or narratives,
- ask the AI assistant for graph-oriented support,
- build visual queries,
- insert interactive result and visualization nodes,
- preview the rendered story,
- export or publish when ready.
The important principle is control: LODEON can assist, suggest, query, and visualize, but the author decides what becomes part of the story.
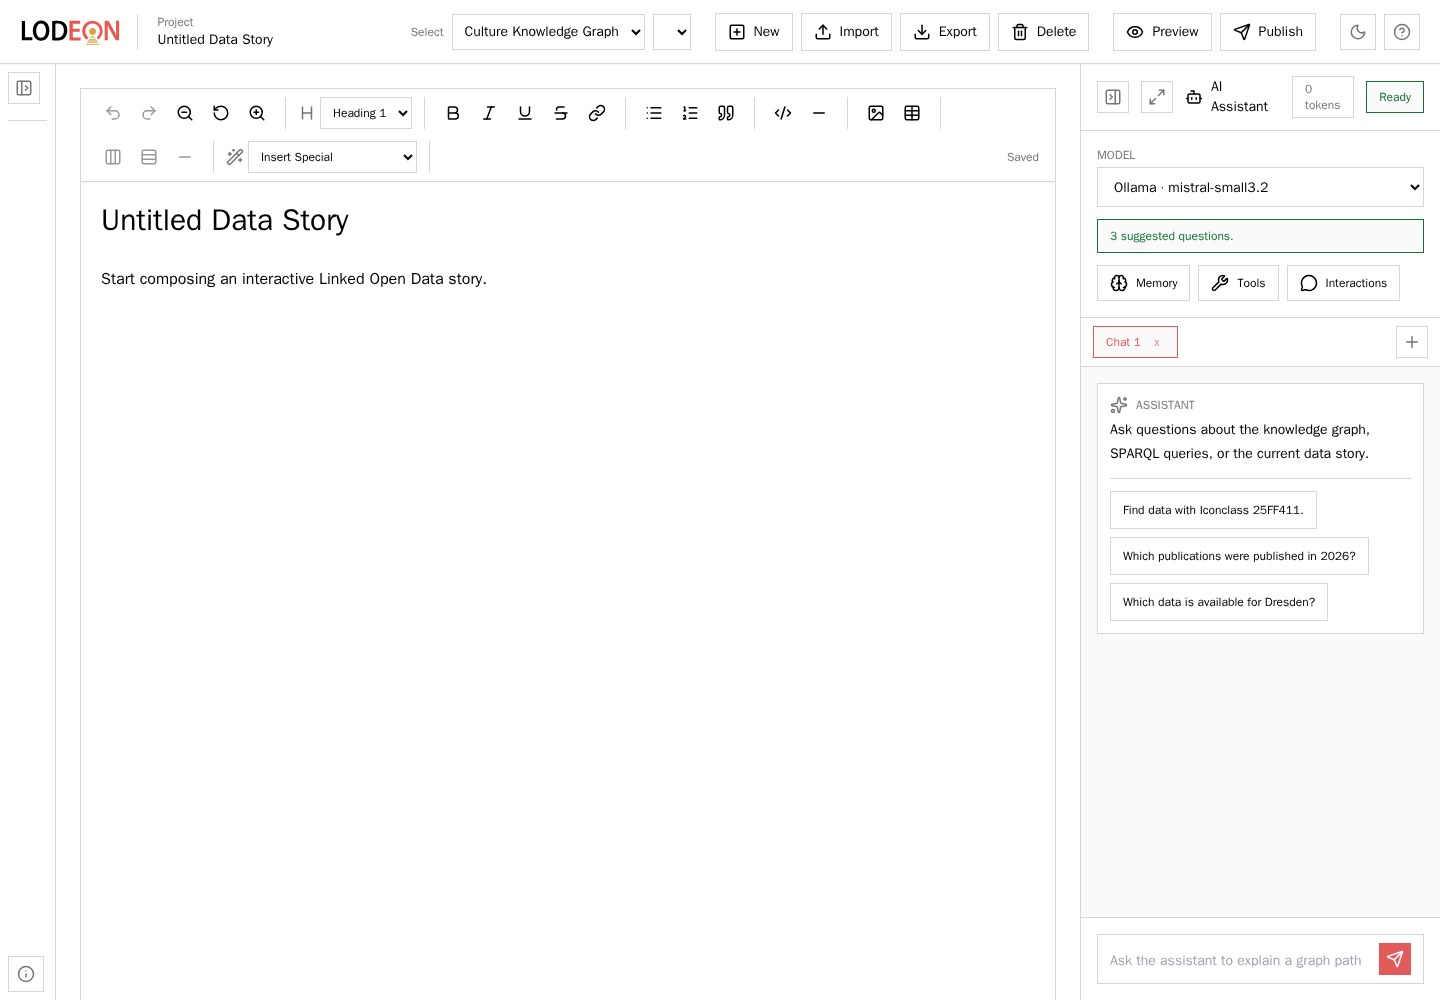
The LODEON workbench combines story editing, knowledge graph selection, preview and publishing controls, and the AI assistant in one workspace.
2. Start with a good question
Begin with something you would actually like to know. A good data story question is concrete enough to search for data, but open enough to become an interesting narrative.
Examples:
- Which data portals are available for a research field?
- Which data items are connected to a person, place, event, or identifier?
- Which publications, software, services, or source items support a specific topic?
- Which graph results can become a chart, table, or reusable story section?
Good questions help the story stay focused. They also help decide which queries, visualizations, and explanations belong in the final text.
3. Ask the AI assistant
The AI assistant helps you explore the selected knowledge graph and turn findings into story material. It can inspect graph structure, draft SPARQL, run tools, summarize results, suggest follow-up questions, and propose insertable story elements.
Use it for tasks such as:
- finding relevant entities or identifiers,
- drafting a query from a research question,
- explaining what a result set shows,
- proposing a story section or visualization,
- suggesting what to ask next.
Keep Force Tool Use enabled when you want the model to base its answer on graph evidence. Use Include Story Content when the assistant should consider the current story text and existing special nodes.
Treat AI output as working material. Check the results, revise the prose, and decide explicitly what to insert.
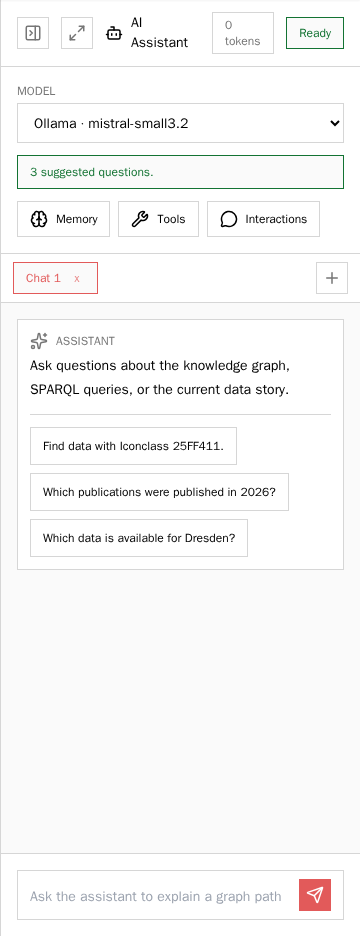
The AI assistant can suggest questions, inspect the active graph with tools, and help turn results into story material.
4. Build a visual query
The visual query builder lets you compose graph queries without writing SPARQL from scratch. Choose classes and relations, add filters, inspect the generated result, and insert the query as an interactive story element.
Use a visual query when:
- readers should be able to inspect the evidence,
- the result is too large to summarize in prose,
- a table or chart should stay connected to live data,
- the same query should remain reusable after publication.
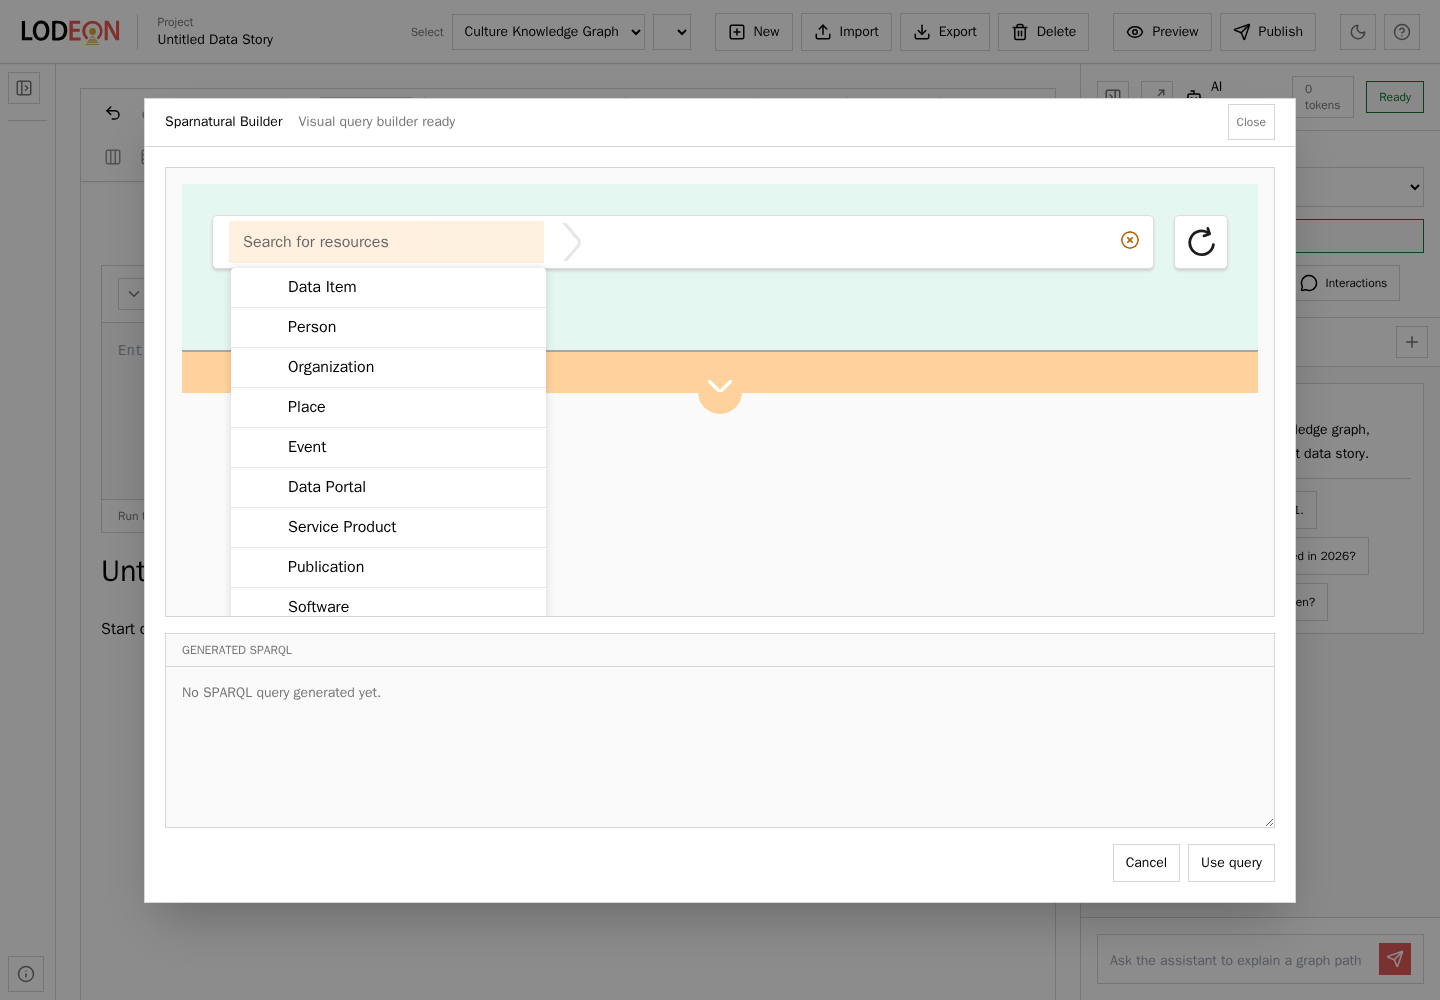
The visual query builder lets authors compose graph queries through classes, paths, and filters.
5. Add interactive story elements
LODEON stories can contain special nodes. These nodes keep data-driven material inside the same authoring document as the narrative.
Common elements:
- Visual query nodes for graph-backed result tables.
- Plotly visualizations for charts generated from query results or CSV data.
- RAWGraphs nodes for visualizations designed externally.
- AI-generated story proposals that you review before insertion.
Interactive elements should support the argument of the story. Avoid adding charts or query results that do not answer a clear question.
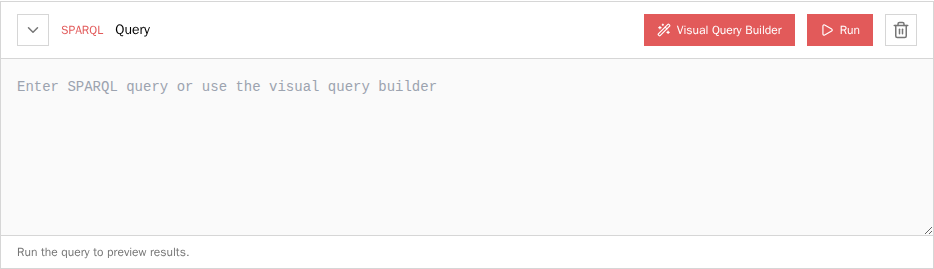
Interactive nodes keep query, result, and narrative close together inside the story.
6. Use linked external sources deliberately
The Culture Knowledge Graph contains links to established identifiers. For questions that require facts held by those external authorities, the Assistant can use verified federated queries to Wikidata, GND, or RISM. Its answer must distinguish the identifier link found in the Culture Knowledge Graph from the facts retrieved from the external service.
The Doria Pamphilj opera-location example uses the collection-specific DHI Rome Partitura service. With Story Proposals enabled, the Assistant can offer a Leaflet map containing the operas, theatres, locations, years, and coordinates returned by that service. This workflow does not use RAWGraphs.
Federation is not automatic enrichment of every identifier. It is used only when the question actually requires external facts or explicitly addresses the configured collection.
7. Shape the narrative
A useful workflow is:
- Ask a focused question.
- Let the assistant or visual query builder help find evidence.
- Review the returned query and result.
- Insert a visual query or visualization node.
- Write a short interpretation around the evidence.
- Preview the story and revise the wording.
When a result set is large, do not turn every row into prose. Insert the query or visualization, summarize the main pattern, and let readers inspect the full result.
8. Preview, export, and publish
Use Preview to render the current story as a temporary page. Preview is useful while drafting and does not publish the story permanently.
Use Export to download a .lodeon.zip package. It contains the full editable LODEON project and generated Markdown for review.
Use Publish when the story is ready. Publishing writes the generated Markdown into the story collection and rebuilds the site.
Good practice
- Lead with a question, not with a technical feature.
- Keep identifiers exact. Do not rewrite GND, Wikidata, Iconclass, RISM, or other identifiers by hand.
- Prefer graph evidence over fluent guesses.
- Use interactive nodes for large or inspectable result sets.
- State when a narrative summary is based on examples rather than all rows.
- Check that the selected knowledge graph profile matches the story you are writing.
- Treat AI output as a draft that must be reviewed before publication.
Next steps
Open LODEON, ask one focused question, and turn the result into a short section with at least one interactive query or visualization.